Catchy headlines
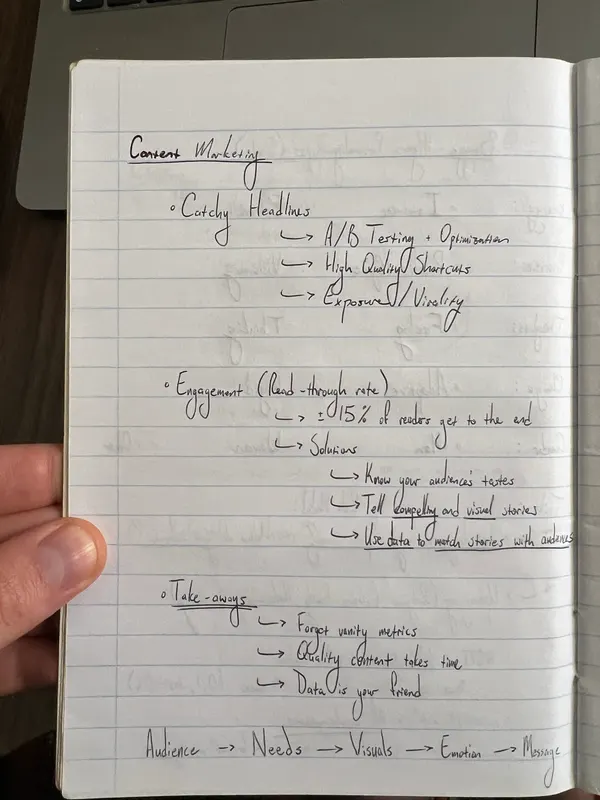
The headline decides whether anyone reads the rest. If it doesn’t get the click, nothing underneath it gets a chance. My notes list three things to work on.
A/B testing and optimisation
Write two headlines for the same piece and show each one to half your audience. Whichever gets more clicks wins. Then write a new challenger and test again. Most email and ad tools can run the split for you.
A Content marketing notes
2.1%
B Why 85% of your readers never finish
5.8% Keep
High-quality shortcuts
A headline is a shortcut to the whole piece. A good one tells the reader what they’ll get, in a few words, and the piece delivers it. Clickbait is a shortcut too, just a bad one. It gets the click, and readers learn not to trust the next one.
Exposure and virality
Reach comes from shares, and people share headlines. Often without reading the article underneath, which is a bit grim, but that’s how it works.
Note: a 2016 study by Columbia University and Inria looked at links shared on Twitter and found that 59% of them were never clicked by anyone. (Gabielkov et al., “Social Clicks: What and Who Gets Read on Twitter?”)
Engagement
Getting the click is half of it. The other half is read-through rate: the share of people who start a piece and get to the end.
The figure in my notes is about 15%. Like so.
If you’ve scrolled this far, check the counter in the corner. It’s doing the same maths on this post. So how do you keep more of them? My notes have three answers.
Know your audience’s tastes
Before you write, know who it’s for. What do they already read? How much time do they have? Are they on a phone on the train, or at a desk? The answers change the length, the tone and the pictures.
Tell compelling and visual stories
This one is underlined twice in my notes. A wall of text loses people fast. Pictures, diagrams and a bit of motion give the eye somewhere to rest, and a story gives the reader a reason to keep scrolling. It’s why this post has moving parts.
Use data to match stories with audiences
Your analytics tell you which pieces people finish, and who those people are. Write more of what gets finished, for the people who finish it.
Take-aways
Forget vanity metrics
Views, impressions and follower counts look great in a report. They don’t tell you whether anyone read the thing. Read-through rate, time on page and replies get much closer.
10,000
views
1,500
read to the end
Quality content takes time
Research, visuals and a few rewrites add up to hours per piece. That’s normal. I’d rather publish one piece people finish than five they skim.
Data is your friend
Check the numbers after every post and let them shape the next one: the headline, the opening, the pictures. It’s the A/B test from section one, run on everything.
The line at the bottom
Right at the bottom of the page, I wrote this.
- Audience
- Needs
- Visuals
- Emotion
- Message
Start with who you’re talking to. Work out what they need, then show it to them in a way that makes them feel something. Only then do you say your piece.